About Blotto
Blotto is a Windows 7/8 application that can help you to improve your chances of winning in
the lottery.
This version specifically targets the Dutch Lotto (www.lotto.nl) but it can also be used for
other lotteries that have the same formula as the Dutch Lottery.
In the Dutch Lottery, you have to choose 6 numbers from a range of 1 to 45 and an
additional colour from a total of 6, in order to win the Jackpot.
The numbers appear on the lottery form in 7 rows of 5 numbers (this layout is important
because one of Blotto’s strategies is based on this layout).
The chance of having the first number correct is 1 in 45, but the chance of having all six
numbers correct adds up to 1 in 8.145.060. Let’s face it, a chance like a snowflake in hell.
Some people claim one has a greater chance to die in a fatal accident then winning a major
prize in the Lottery. Well, if that is what keeps you from participating, you leave chance no
alternative!
What can Blotto do for you? Let’s be honest, it does not come with a guarantee to win. I
make no such claims. You still need (a lot of) luck to win.
Blotto lets you examine the behaviour of the draw system, based on prior draws. You can
then decide on the strategies that Blotto offers and let Blotto work out the best set of
numbers to play with.
Blotto comes with a data file that holds the results of 187 recent draws on which Blotto
bases it strategy.( Blotto absolutely depends on this file being present in the application
path and containing valid data or Blotto will gracefully exit after a formal protest).
When you run Blotto, it starts by presenting you an overview and statistical analyses of
these 187 draws:
Blotto Lotto Generator for Windows 7/8/10
(Needs .NET Framework 4)
|
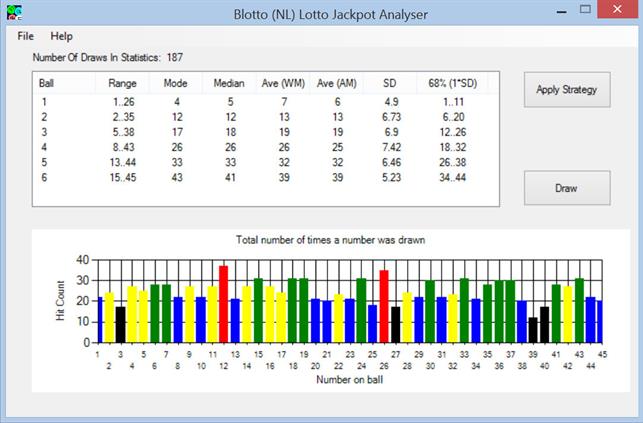
| Figure 1: Blotto Main Screen |
System Bias
If we look at the bottom graph, we see that although every ball has an equal chance to be drawn, number
12 has been drawn nearly 40 times whereas ball 39 appeared slightly over 10 times.
We call this effect machine bias or system bias. The system favours some numbers above all other.
The law of large numbers dictates that given enough draws, the line in the graph will be a straight line
from left to right. But in the last 187 draws this is not the case. In The British National Lottery they draw
with two different systems, named Lancelot and Guinevere, in order to fight system bias and prevent
punters to play on a biased system.
Blotto lets you play on this bias by means of it’s Bias Strategy.
Stochastical Analyses
The top half of the Blotto main screen shows the characteristics of ball number 1 to 6, when put in
numerical order. The first ball (after sorting) cannot be lower than 1 and has not been higher than 26.
The last ball has never been lower than 15 and of course, never higher than 45.
Blotto shows some information about averages that are commonly used in chance calculation such as
the Mean (M) and the Standard Deviation (SD or SDev). Although the Lottery data is not suitable for
such analysis, it has nevertheless been taken on board to give you an extra fuzzy logic to play with in
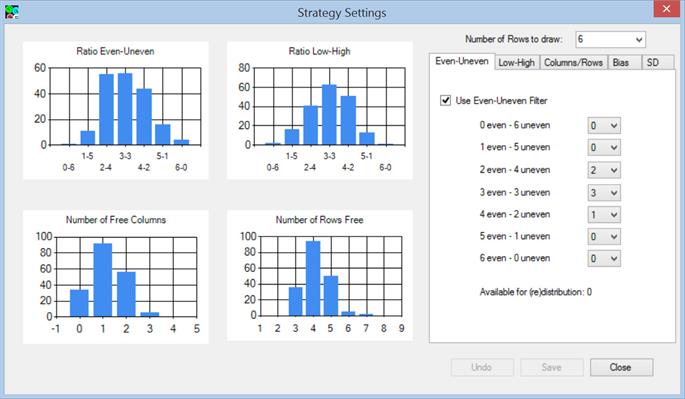
We continue our tour of Blotto by pressing the ‘Strategy’ button which brings up figure 2, the Blotto
Strategy page.
|
| Figure 2: Strategy Settings |
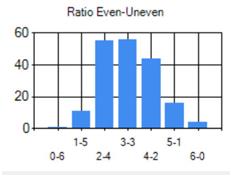
Ratio Even-Uneven Strategy
The numbers 1 to number 45 are alternating even and
uneven, albeit that there is 1 more uneven number
then even ones. So, the chances of drawing even or
uneven are 48,9%-51,1%. More or less a 50-50
chance. One would expect that most of the draws will
consist of 3 even and 3 uneven numbers. The graph
shows that most of the draws fall in the 3-3 category
and 2-4 category. The 2-4 category may be as high
because the uneven category has 1 member more in
the collection.
We can also see that it hardly ever happens that all balls are even or all uneven. So, in the
last 187 draws it has been pointless to hand in a play form with selections in this category.
In the strategy panel you can select with how many rows you what to participate (1 to 40).
On the Even-Uneven tab you select how you want to distribute these rows over the classes
of even and uneven.
Note that if you choose to use this strategy, the total of numbers in the Even-Uneven filter
must add up to the total of play rows to draw.
You can also decide not to use this strategy by un-checking the filter box.
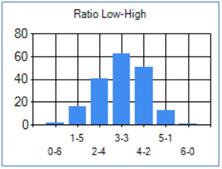
A division in two categories, as has been made in the
Even-Uneven strategy, can also be made by defining the
numbers 1 up to 22 as ‘low’ and 23 up to 45 population as
‘high’.
In the Ratio Low-High Graph we see that the 3-3
category is the highest (as expected) and the 4(low)-2
(high) category is higher than the 2(low)-4(high). This is
unexpected as the High class has 1 member more and
should render a relatively higher rate in the 2(low)-4(high)
category. This may show that the system is biased to
favour the lower numbers 1 to 22.
We also see that it hardly ever happens that all balls fall in either the range 1 to 22 or the
other. So, in the last 187 draws it has been pointless to hand in a play form with selections in
this category, just as we have seen in the Ratio Even-Uneven Graph.
In the strategy panel you can select with how many rows you what to participate (1 to 40).
On the Low-High tab you select how you want to distribute these rows over the classes of
Low and High.
Note that if you choose to use this strategy, the total of numbers in the Low-High filter must
add up to the total of play rows to draw.
You can also decide not to use this strategy by un-checking the filter box.
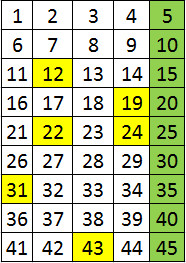
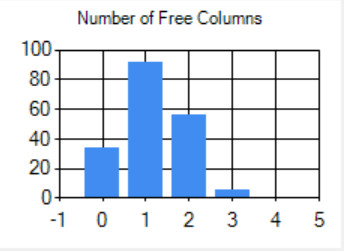
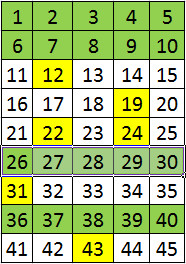
If we look at the layout of the play form, it looks schematically like this (picture left)
The play form shows 6 selected numbers in the 3(even)-3(uneven) class and in the 3(low)-3
(high) class. The current selection has left 1 column free.
As we can see in the graph (picture right), this was the case 90 times in the last 187 draws.
With the Free-column filter you can force Blotto to generate rows that satisfy your settings.
Note that if you choose to use this strategy, the total of numbers in the Column filter must
add up to the total of play rows to draw.
You can also decide not to use this strategy by un-checking the filter box.
Free Rows Strategy
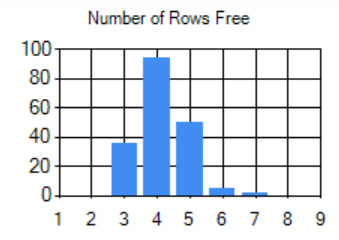
If we look at the layout of the play form, it looks schematically like this (picture left)
The play form shows 6 selected numbers in the 3(even)-3(uneven) class and in the 3(low)-
3(high) class. The current selection has left 4 rows free.
As we can see in the graph (picture right), this was the case nearly 100 times in the last
187 draws. With the Free-row filter you can force Blotto to generate rows that satisfy
your settings.
Note that if you choose to use this strategy, the total of numbers in the Row filter must
add up to the total of play rows to draw.
You can also decide not to use this strategy by un-checking the filter box.
Blotto's approach of generating play rows
After you have looked at the graphs and chosen your personal strategy, it is nearly time to
set Blotto to work with your established parameters. As Blotto cannot foresee the future it
will try to mimic the Lotto’s machine behaviour with your parameters by generating play
forms at random.
It then checks each generated play form against the 187 past draws and keeps the best one
as it goes on as long as you let it run.
Blotto has two more strategies that influence the outcome of each generation cycle. These are the
But before we take this matter any further,
let us look at a normal draw.
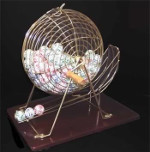
At the time of a normal draw, done by the
Lotto Organizer, we can all see how 45 balls
tumble into a round sphere that turns around
and we see all these balls bounce about until
6 are randomly taken out and form the
outcome of a draw.
Blotto however does not use 1 sphere but a dedicated sphere for each ball to draw. Like this:
Blotto has split the sphere up in 6 separate ones, all dedicated to 1 of the six balls that
drop out of the machine.
The keen observer will notice that Blotto has taken these numbers from the statistical
analyses as displayed in the Blotto Main screen.
With Blotto we can influence the contents of these 6 spheres in two ways, with the SD
Strategy (see #SD) and the Bias Strategy (see #Bias).
With release 1.3.0.0 of Blotto a new built-in approach has been added.
Where as humans have a tendency to evenly distribute lottery numbers in a playfield, a
German documentary on the subject revealed that in fact these numbers have a
tendency to huddle together, making the draw results, for want of a better word, lumpy.
Blotto tries to emulate this by adding the previous drawn ball neighbours to the following
sphere for the next number to draw. This enhances the chance for this ball to be
selected thus stimulating 'lumpiness'.

|
| Figure 3: Blotto’s 6 virtual dedicated lotto spheres. |
SD Strategy
In the statistics of the Main Blotto screen we see that ball 1 has an Average (AM) of 6
and a Standard Deviation of 4.9. As said before, the Lotto numbers are in fact not
suitable for this approach but we use it nevertheless because it gives us something to
experiment with and introduce a certain ‘je ne sais quoi’. All very unscientific but we
don’t care.
So, had these numbers indeed be suitable for Chance Evaluation, then a Standard
Deviation of 1 means that 68,2% of the draws range between 6 (The Average) and
plus and minus 1 * 4.9 (SD).
The outcome of this equation is a range from 1 to 11, as shown in the Statistical
Analysis.
SD 2 would give a 95,4% chance of the ball 1 falling in a range of 1 and 16
SD 3 would give a 99,6% chance of the ball falling in the range of 1 to 21
SD 4 would give a 99,8% chance of the ball falling in the range of 1 to 26, which forms
the total range for ball 1 as shown in the Statistical Analyses.
If you do not wish to use this strategy then put the SD value on SD 4 so that all the
numbers of the range become part of the 6 separate virtual Blotto spheres.
Bias Strategy
In Figure 3 when have seen that Blotto uses 6 separate virtual spheres that each contain
a set of numbers that are valid for each ball in the draw.
With the SD Strategy we have seen how we can narrow down the range of balls that
Blotto loads in a sphere.
Now it is time to do something about the System Bias that appears to favour some
numbers and discriminates others to a certain degree.
For this purpose, Blotto has put each number in a Speed class and gave it a designated
colour. This is shown in the Bottom half of the Main Screen.

|
| Figure 4 : All the numbers and their Speed class |
|
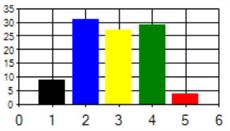
| Each Class shows its % in partaking in a draw |
Blotto recognizes 5 Speedclasses
1.Dead (Black)
2.Slow (Blue)
3.Average (Yellow)
4.Fast (Green)
5.Hot (Red)
|
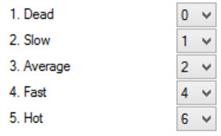
| Bias Settings |
Each number in the list boxes is a multiplication factor that
determines, how many times a ball that falls into this
category can be part of a single virtual sphere.
A bias factor of 0 for dead numbers means that none of
these numbers will appear on your play form. This
effectively means that 4 numbers of Category 1 are
completed ignored by your now somewhat biased system.
Your chances of winning have risen dramatically because for you, the population in the draws is
limited to 41 numbers instead of 45!
We can further bias our system by saying that we want Hot numbers to appear 6 times in a sphere.
This means that e.g. number 12 will appear 6 times in each sphere that it is part of. This increases
the chances that this number will be randomly selected by Blotto’s generator.
But perhaps you hold the view that, given the Law of Large Numbers, all numbers will strive to form
a straight line. In such a scenario you might want to favour the slow ones as they must make
haste and should appear in more draws pretty soon. Well, you decide!
You can put these factors as high as the list boxes allow, it has nothing to do with the numbers of
draws on the play form.
Additional Strategy - The Blotto Datafile
Blotto comes with a data file that holds the results of 187 draws on which Blotto bases it’s Statistical
Analyses. Blotto absolutely depends on this file being present in the application path and containing
valid data or Blotto will gracefully exit after a formal protest.
It is important that you update this data file on a regular basis to keep the generator results
meaningful.
You can do this by opening file lotto.dat with Notepad or another flat text editor and type in the new
results at the bottom of the file and by removing as many from the top row as you have added at the
bottom. The record layout is:
{nr1},{nr 2},{nr 3},{nr 4},{nr 5},{nr 6}, 99 (close record)
Example:
7,10,14,17,28,35,99
3,7,26,27,36,43,99
2,6,11,19,36,44,99
4,11,20,24,31,44,99
1,3,10,14,33,37,99
16,18,27,33,34,41,99
Make sure you use the above format or Blotto will gracefully bail out after a formal complaint.
You can also decide to change the number of rows in the data file as you see fit. However, if you
make it too small, Blotto has nothing to work with and if it’s too large, the Law of Big Numbers
becomes your enemy.
You can also check the website of Nice Software(www.nicesoftware.nl) for updates of the data file.
By now, we have decided upon our strategy and after saving them we exit the Settings form and
return to the Main screen and press the ‘Draw’ button.
The Blotto Generator at work
|
| Figure 5: The Blotto Generator |
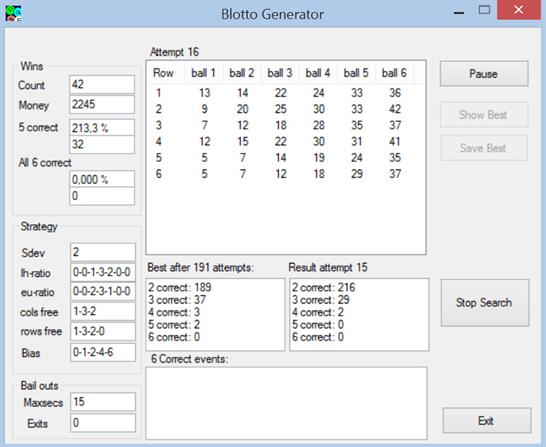
The Blotto Generator continuously generates your chosen set of play rows (Figure 2: Strategy
Settings) and checks the set against the draws in the data file. It checks how the set would have
done if it had been playing for, in this case, 187 draws and adds up de hit count and the prize money.
It keeps the best in memory for you to see and save on demand to an Excel csv file.
If somehow Blotto cannot find any rows that satisfy your chosen strategy, it will stop trying after 15
seconds and give you whatever it found last. If the bail outs happen to frequently, you may have to
adjust your strategy.
Well, the rest of the form is pretty straight forward. Just let it run a bit and see if still is finding
better draws. Keep in mind that all depends upon your data file being up to date in order to keep
the outcome meaningful.
In my honest opinion, you have now greatly enhanced your chances of winning but alas you need
also to be lucky enough to win. You see, Blotto can by means of Statistical Analysis explain the past
and extrapolate as best as possible but it cannot foresee the future. And remember, a person that
fully depends on statistics, may drown in a river that is on average 1,5 meters deep.
On a final note, if you do have a nice win, please let us know in our guestbook.
Good luck to you all!
Ben Kalkhoven
Nice SoftWare!

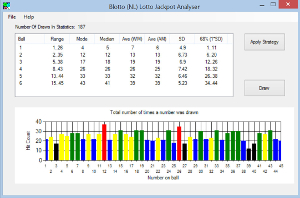
Best Winresult Strategy
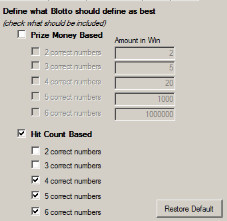
As will be explained in section 'The Blotto generator at Work', the generator keeps on generating numbers until you say it is enough. Meanwhile it keeps the best result in memory. What is the best result, you may ask. Well, you decide. You can base the best result on either the highest
amount won or simply by counting hits.
The default settings are based on the Hit Count and counts only 4,5 and 6 numbers correct without taking the amount of money won into consideration. You can freely check or uncheck categories as you see fit.
If you choose for a Prize Money based approach, the amount won for each category is defaulted but you may change these values if you want a different weighing factor.

